Editor's Choice, November 2017: Our World in Data, and in darn good visuals too
I've done my time. Rummaging in World Bank and United Nations Data sets. Trying to produce the graph that conveys what a non-statistical audience needs to know. Conveying enough development data to put the big picture context around the urgency of inclusive business, without boring a business audience. It's tough. That's why I welcome and share Our World in Data - a online source with oodles of data that is relevant, useful, well documented, and wonderfully visual.
I share this treasure trove with you, the inclusive business practitioners, for another reason too. Inclusive business is challenging. Attention is naturally drawn to details of the model, price points, ROI, marketing or aggregation strategies, lack of finance or lack of pipeline. We know that the world needs a new kind of business, that poverty and inequality remain stubbornly high and need business action alongside others. But too often we bury our heads in the business grains of sand. It is hugely important to keep the big picture of what is happening in the world: income trends, health and mortality, democracy or conflict, emissions and degradation.
So here is my challenge or my offer. Go rummage on Our World in Data. Give yourself 15 minutes, and find something that surprises you. And probably something that helps set your own work in context. And something you will want to snap, pass on through social media, or put on the front of your next presentation or report. You can even find graphs that guide you visually through shifts over time, either click by click or by downloading an animated file.
You may well also be pleasantly surprised. Max Roser, the driver, is all for reminding us just how much progress we have made over recent centuries. This visual is one way of summing up a host of positive change over 200 years:
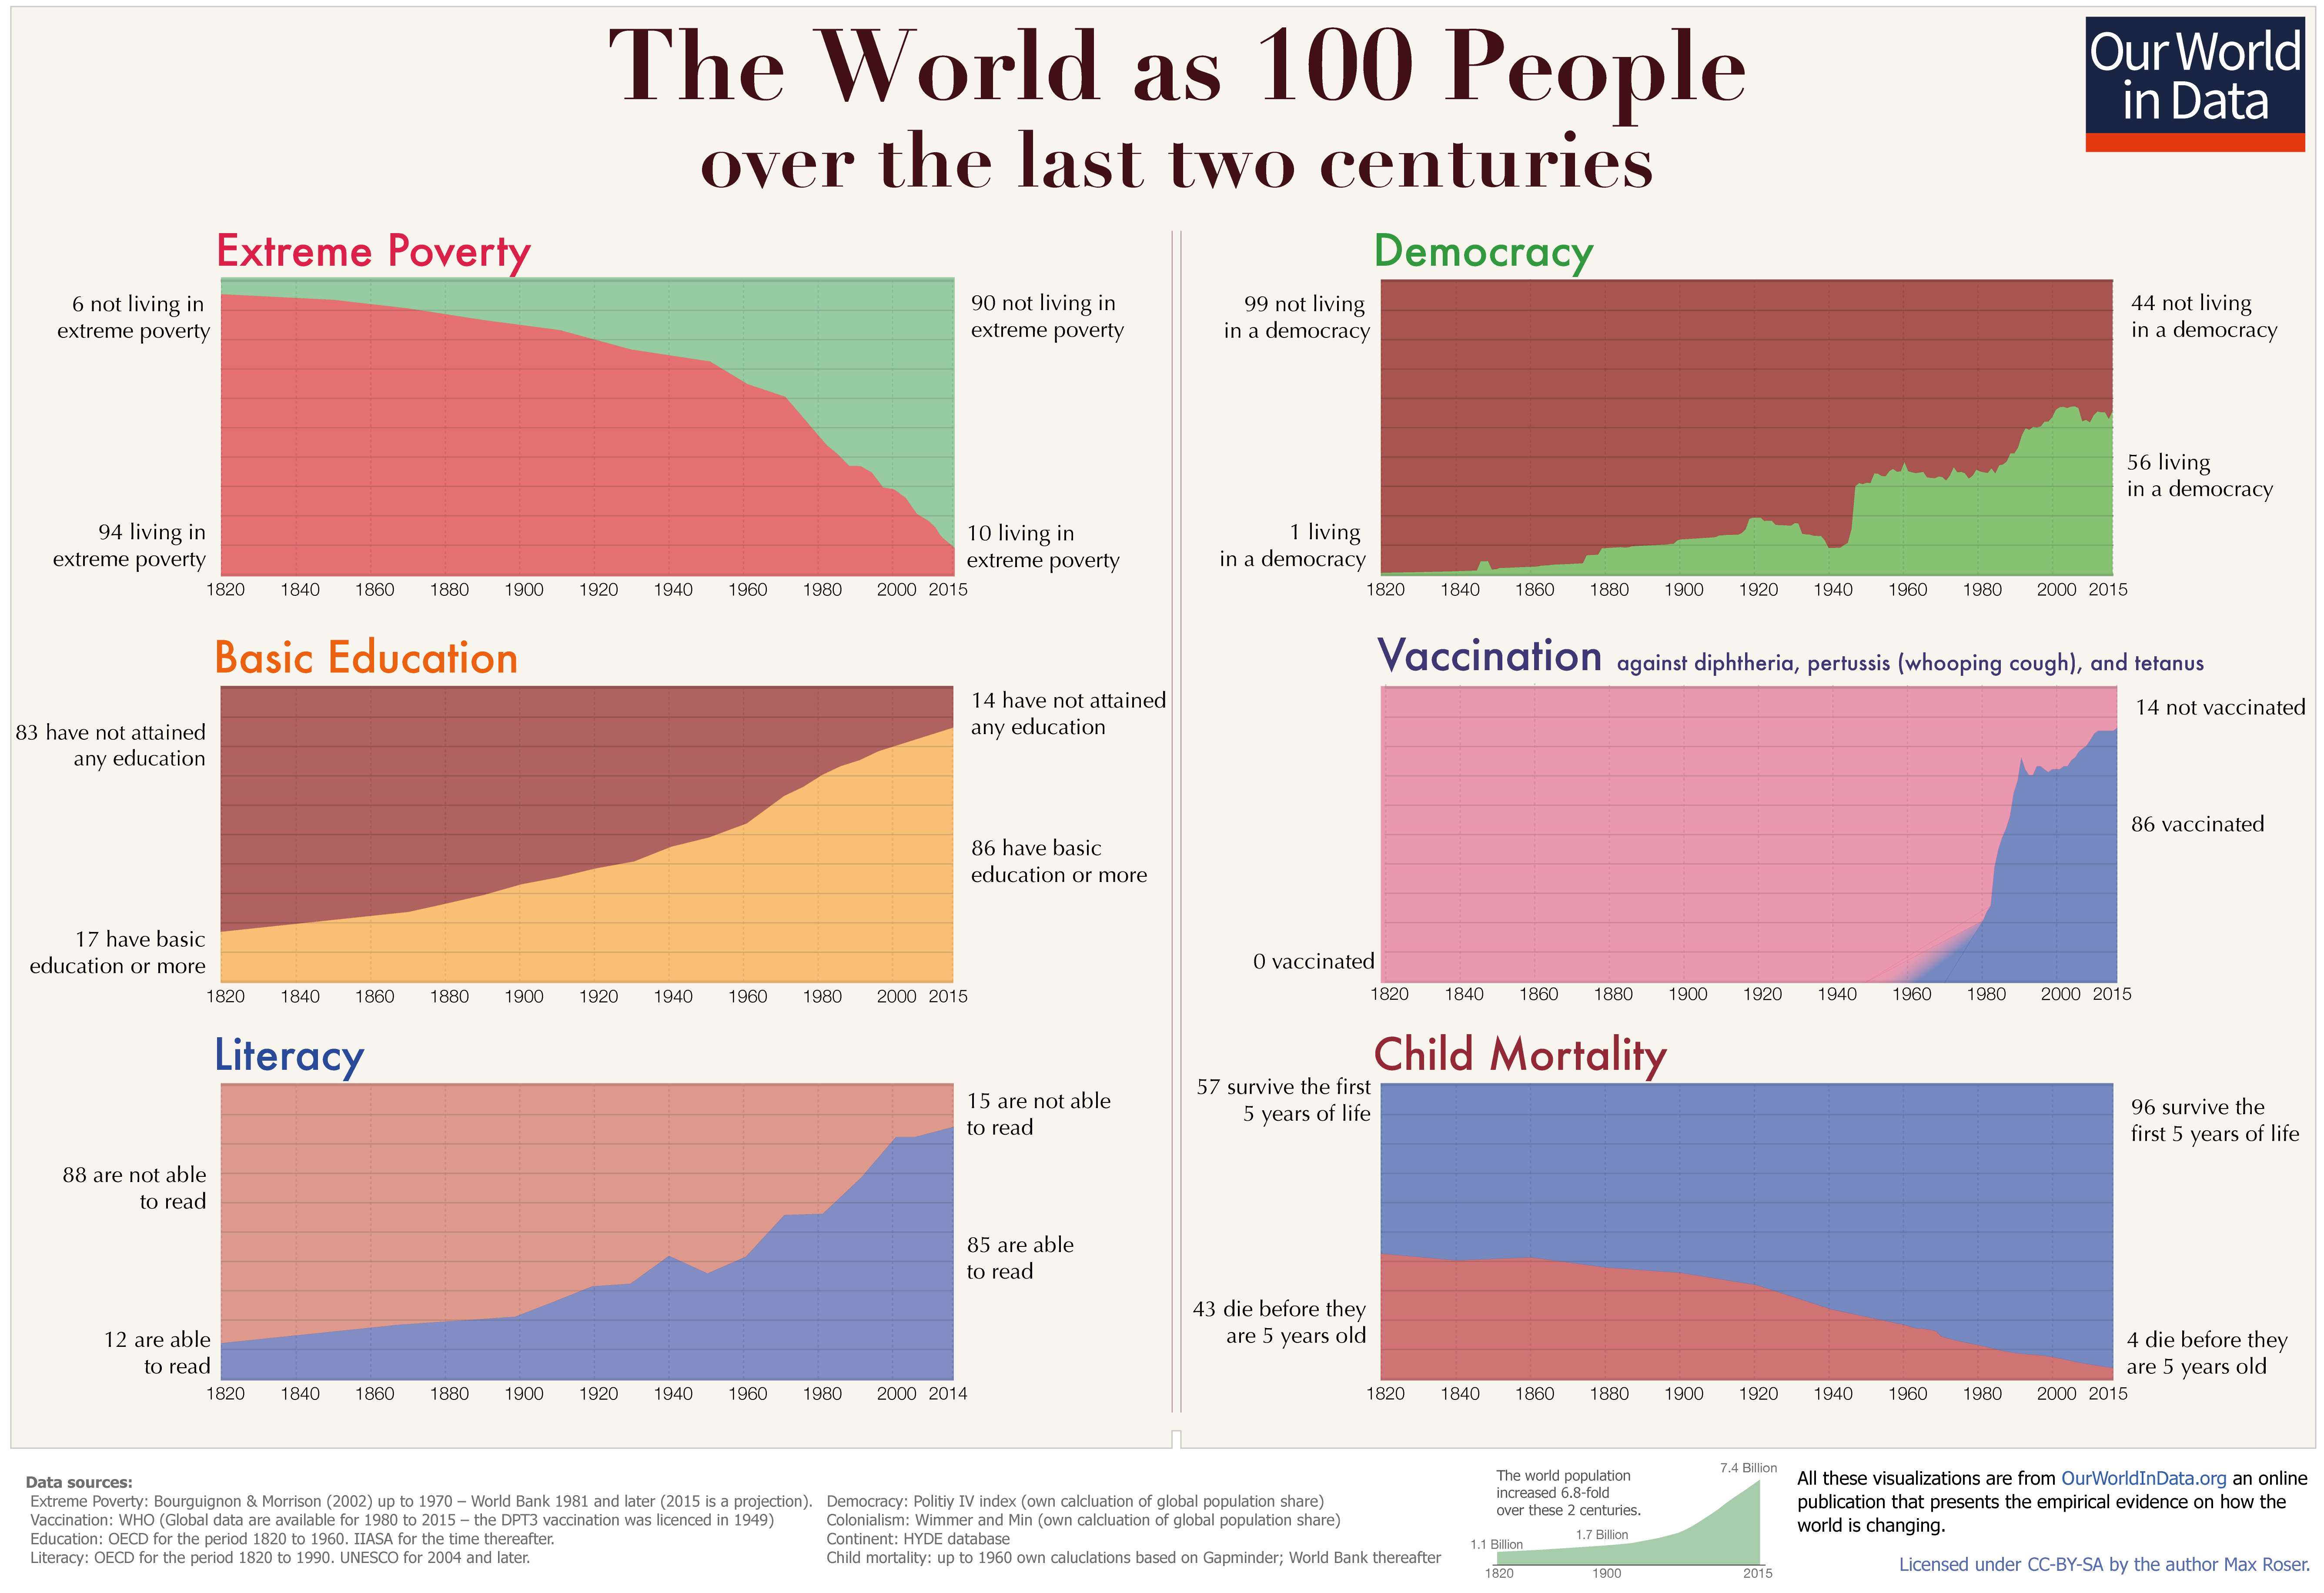
The message is more positive than much else - warnings of another Editor's Choice, the Better Business Better World report, that if business does not change the future is grim. Warnings on climate change, and what happens when we miss 2 degrees. But the authors argue that understanding progress as well as challenge is needed to build our faith in humanity and potential to change.
They don't shirk from the bad news either. Here's one on changing temperatures so far.

A rich article discusses trends in global inequality and poverty, pointing out huge progress. But at the same time, it will take decades or centuries for the poorest 10 per cent today (earning $480 PPP) to enjoy the income of todays' 10% at $14,500 PPP).

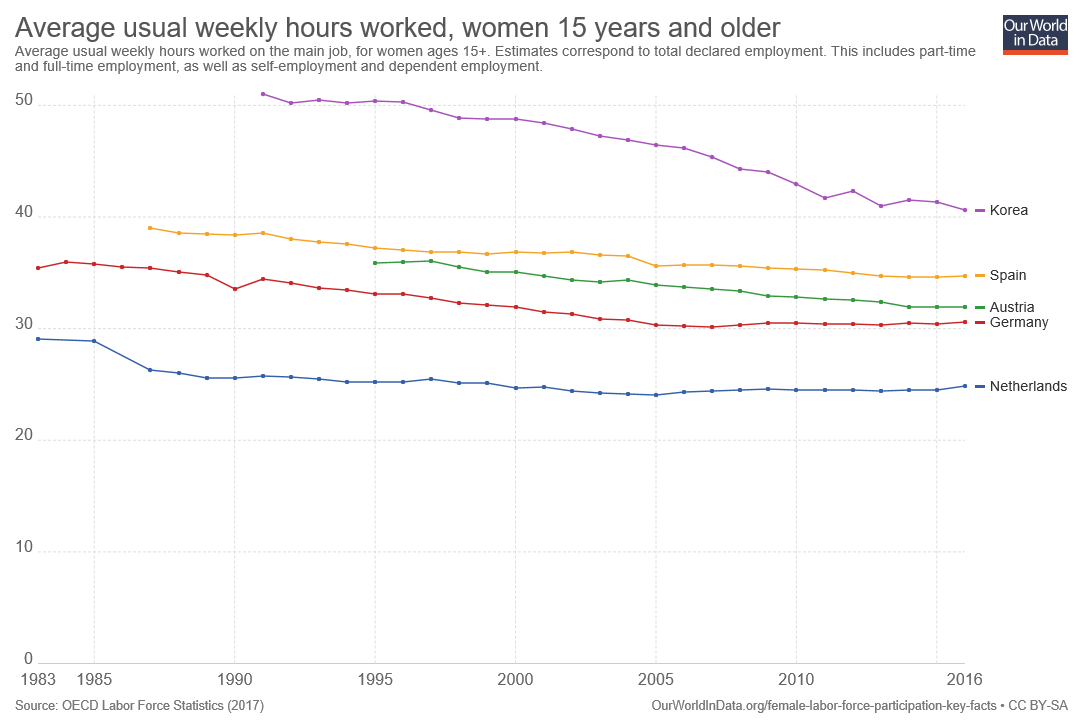
This is not just a lot of graphs. You can go into the data yourself, chose particular countries or regions. For example, this graph below shows women's labour force participation for all regions, but you can edit yourself selecting specific countries. Better still, beyond the data, there is analysis of what is influencing the trends.
There is data on food, pesticides, fertiliser, mortality and disease rates, education, fossil fuels and forests, land use, technology and trust. Go rummage. Enjoy.
More Info
The website is www.ourworldindata.org and the twitter feeds are @OurWorldInData and @MaxCRoser.
The first visual if from https://ourworldindata.org/a-history-of-global-living-conditions-in-5-charts/
The second on temperature is from https://ourworldindata.org/co2-and-other-greenhouse-gas-emissions/
The third image, the table is from https://ourworldindata.org/global-economic-inequality
The fourth image on labour force participation is from https://ourworldindata.org/female-labor-force-participation-key-facts
Previous Editor's Choice reviews dating back to 2010 are all listed on http://www.inclusivebusinesshub.org/editors-choice/
This blog is a part of the November 2017 series on data for inclusive business. Read the full series for insights on how the data revolution could affect inclusive business. Will it bring an end to the uncertainty of business in Base of Pyramid markets? Can it straddle the development-business divide? Will the data drive spurred by the Sustainable Development Goals be useful to inclusive business?