Breaking through at the BoP: A sector comparison of the inclusive businesses in the BCtA portfolio
With inputs from Joe Shamash
In which sectors is inclusive business flourishing? Which are showing strongest performance in terms of revenue or reach to the Base of the Pyramid? Why are Health and Energy initiatives reporting slow progress, yet demonstrating high reach? Is Financial Inclusion the easiest success story?
It is early days to come up with any conclusive answers, but a review of Business Call to Action members reveals some interesting trends. For the report, Breaking Through: Inclusive Business and the Business Call to Actio... ,we reviewed 94 initiatives which companies have committed to BCtA, and focused in on 49 initiatives that were involved in interviews and surveys. These initiatives can be grouped into seven different ‘impact sectors’ based on the type of benefits they aim to generate for people at the Base of the Pyramid (BoP).
Almost half the current BCtA initiatives are focused on delivering either Agricultural Development (26%), or improved Healthcare and Nutrition (22%). The next three largest groups are delivering Employment and nterprise, Financial Inclusion, and Energy (each around 15% of the portfolio). Finally there are just four initiatives, or 4% of the BCtA portfolio, that deliver Education, and the same again delivering improved Shelter and Living Conditions.
The report has a chapter on each of these ‘impact sectors’ detailing the types of initiatives. This article explores the high level comparisons across the sectors, looking at how they vary in the progress and trends they demonstrate.
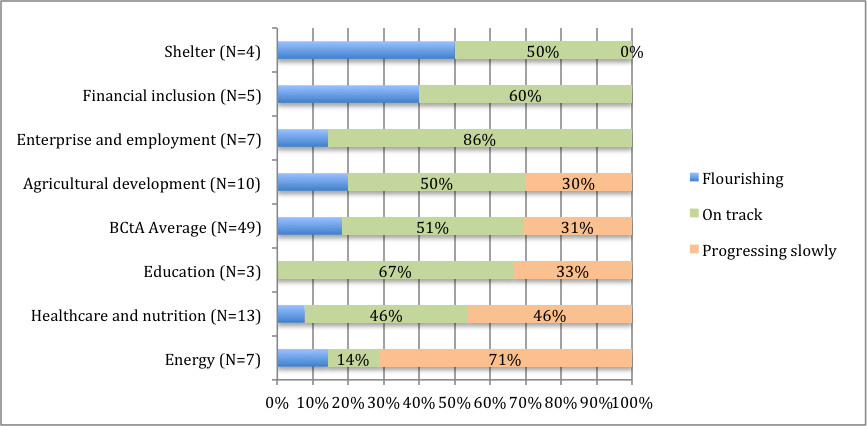
During our research, we asked each company to judge their own progress: are they flourishing, progressing on track, progressing slowly, or stalled? Those involved in providing Shelter, Financial Inclusion, Enterprise and Employment all felt they were flourishing or on track .In contrast, in Energy, Healthcare and Education, there were several reporting slow progress, as Figure 1 shows:
Figure 1: Companies’ perception of progress, breakdown by sector
But we also found that a company’s own perception of current progress is not a strong indicator of social results to date. There is no correlation between reported progress and actual reach to people at the Base of the Pyramid, no doubt due to the very different timetables and types of products or benefits in such a diverse range of initiatives. And then again, the number of beneficiaries reached does not correlate with revenue.
Figure 2 illustrates estimated numbers of people reached per initiative, again grouped into sectors and shown in the same order as in Figure 1.
Figure 2: Estimated reach to BoP beneficiaries per initiative
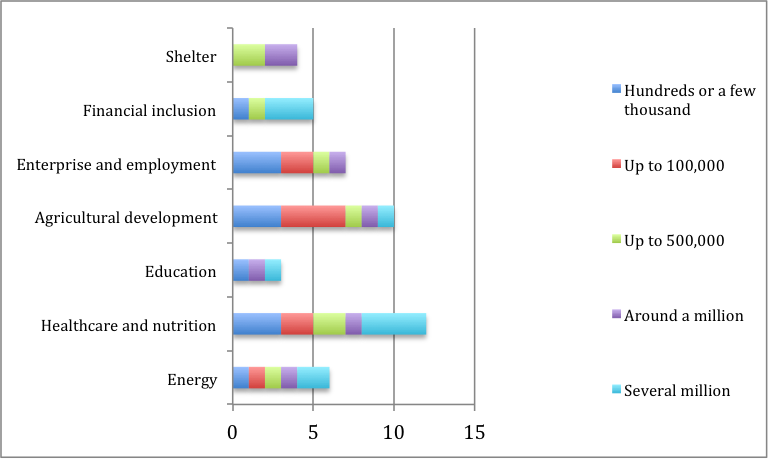
We can see that many of the initiatives that have already reached millions of people are actually in sectors where respondents are less positive about their progress to date – particularly healthcare and energy. Note that for comparability, the numbers of beneficiaries reported here includes those reached as customers, suppliers, employees and entrepreneurs, plus their household members.
We estimate that the 49 initiatives covered in the survey have already reached around 40 million households, or 200 million people. The majority of these people are gaining access to financial services, health services, or energy. The sectors themselves are diverse, and sample sizes small. Taking into account the data and comments, we identify several trends.
- Inclusive business in the Finance sector is thriving and scaling. Strong potential is driven by use of ICT and strategic partnerships. We estimate BCtA initiatives in finance have reached over 20 million users of their products, thus counting as over 100 million beneficiaries to date.
- In Health there appears to be huge potential to scale, supported by ICT and sometimes government support. Versions of low-cost primary care models using para-skilled workers and ICT are spreading. Aside from these, there are now a wide variety of products and services that also relate to improved health or nutrition. Most nutritional initiatives are still at early stages and not yet proven. Initiatives in the health sectors overall have provided a service to over 12 million patients or clients to date, thus counting as over 60 million beneficiaries when we multiply by household size.
- In Energy, there are both failures and real breakthroughs. At least two initiatives have failed. But prospects for rapid growth seem strong where products and business models have been proven. Companies are securing equity investment and business-to-business partnership to scale. Initiatives in this sector have already provided power for around 40 million people.
- Shelter and basic services initiatives are relatively few, but are showing just how determined BoP households can be to invest in improving their living conditions year by year, despite the considerable cost relative to their income. We also see how determined companies can be to make models work with business models continuing to evolve at local level. The four housing initiatives have provided low cost housing for around 2-3 million people.
- Agriculture is a challenging sector, requiring companies to step into the unknown with substantial long-term commitment, but is showing results. On the ground engagement to develop farmer capacity is common across diverse approaches, irrespective of whether companies are buying supplies from farmers or selling inputs to them. Across the portfolio, around 3.4 million people in farming households have benefited to date.
- In Education initiatives, there are two key enablers for inclusive innovation: ICT and having government support. It is a small area so far within the portfolio, but with some initiatives moving quickly to scale. They have reached around 2 million users (mainly of ICT-based products).
- There is a wide variety of initiatives to create Jobs and opportunities for entrepreneurship. There is no common model here but good performance is emerging. Initiatives are not just creating more jobs but also improving the quality of jobs and employability too. They have created or improved jobs for hundreds of thousands, benefiting perhaps a million household members directly, plus multiplier effects locally.
As ‘Breaking Through’ points out, we would be foolish to judge success simply by the number of people reached. The depth of impact, the durability of impact, and the secondary effects, are critical to poverty reduction, and this is nowhere more true than when jobs are created (the issue of breadth vs depth will be covered in more depth in another blog in our series).
Finally, let’s consider revenue. The majority of inclusive business initiatives have turnover in the range of $1million to $10million per annum. There are a few that are nudging into the highest category, which is $10million to $100million. These are in shelter, education, energy and health. Some of these are operated by multinationals, and some by emerging and maturing companies that are achieving scale.
Figure 3: Revenue per initiative, by sector

Taken together, the figures for revenue and numbers of beneficiary paint a picture of the scale of impact achieved by initiatives. Shelter initiatives, for example, report lower than average numbers of beneficiaries but higher than average revenues, because of the high value of goods and services they make available.
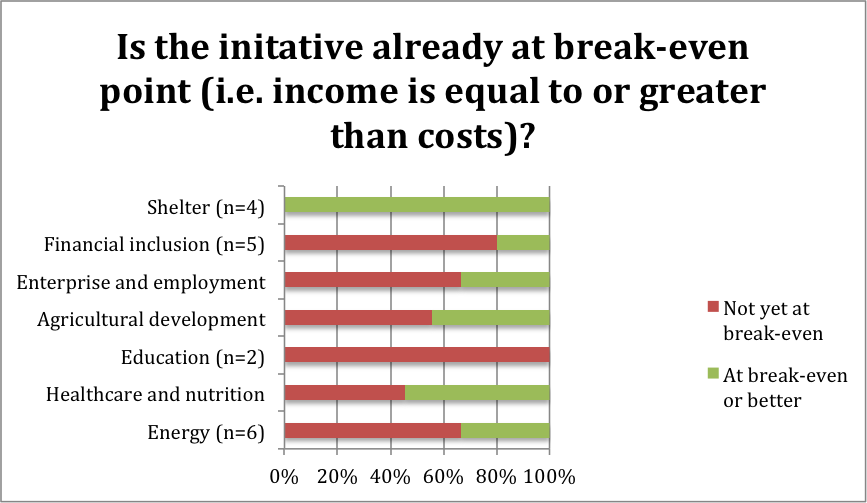
There is some partial correlation between revenues and the ability of initiatives to break-even(income equal to or greater than costs), with a quarter of those with revenues below $1mn reporting they are at break-even or better, compared to half of the initiatives with revenues above $1mn. Overall, slightly less than half the initiatives reported that they were already at or past break-even, including all four shelter initiatives, 55% of health initiatives and 44% of agriculture initiatives.
Figure 4: Is the initiative at break-even?
So in summary, there is no single ‘breakthrough’ sector. We can answer a series of questions on how sectors compare, bearing in mind small sample sizes:
- Which sectors are most common in the BCtA portfolio? Agriculture and Healthcare
- In which sectors do companies perceive strongest progress? Shelter, Financial inclusion and Employment.
- Which sectors have reached most beneficiaries so far (per initiative and across the sectors, assuming we can multiply by household size across them all)? Financial inclusion, Healthcare and Energy
- Which sectors have initiatives reaching over $10millionn per annum in revenue? Shelter, Education, Healthcare and Energy
- Which sectors have the most initiatives at break-even or better? Shelter, Healthcare and Agriculture
What is common for all the inclusive businesses striving for impact in these sectors? There are plenty of challenges, but also clear drivers for scale, and market opportunities that far exceed achievement to date.
About ‘Breaking Through’
Breaking Through: Inclusive Business and the Business Call to Actio... is authored by Caroline Ashley and Suba Sivakumaran, in conjunction with Tomohiro Nagasaki, Lara Sinha, Suzanne Krook and Tom Harrison. Joe Shamash conducted the online survey and led the data analysis. Five years on since BCtA was launched, it reviews progress made by BCtA members and the strategies they are adopting. The report covers BCtA members’ 94 initiatives and draws heavily on surveys and interviews conducted with 49 initiatives during mid-2014.